Generating 360 degree feedback reports is one of the most fundamental components of the entire 360 feedback process. It allows for accountability, clarity and action. Without the 360 report, how are you going to take appropriate action? Although the individual 360 report might be viewed as the end result of the process, you should be mindful that it might actually be only the start of the journey towards management or leadership development. Unless those development actions are undertaken by the 360 feedback participants, your investment up to this point will be diluted.
360 feedback reports are used as a visual way to present feedback. The physical report is easily accessible, with attractive visuals and intuitive reporting. At click360SelfDrive, our digital 360 reports are full colour and use high-resolution graphs and charts to display feedback responses in an engaging way. Our 360 reports are divided according to your chosen competency framework, making it easy to review competence across the various elements of the job role. In addition, the integrated workbook makes it easy for the participant to interpret their data and to capture their reflections. This culminates in their development action plan.
What Is A 360 Feedback Report Used For?
The purpose of 360 reports is to give participants feedback on how they are perceived by their manager(s), peers, direct reports and other stakeholders, as compared to how the participants see themselves through their own self-assessment. Other stakeholders may include internal or external customers, or some other influential people, who may be impacted upon by the individuals’ behaviour. The 360 report is then used to identify and recognise strengths and areas for development.
Your 360 degree feedback report is a tool and a starting point for discussions and is most powerful when used in this way. But on its own, the report does not give you the whole picture. What is important is that you check out the feedback with the relevant people involved so you can understand the whole story and have answers to your questions. But we’ll cover the checking in and checking out process in more detail in a later blog.
Importance of 360 Feedback Reporting
We recognise the importance of effective 360 reporting across all different sized organisations. It enables employees to quickly provide insightful and actionable feedback to colleagues, typically those in leadership and management roles.
360 reports are also a great way to identify and group together organisation-wide trends, highlighting areas of similarity and areas of difference and exposing organisation-wide skills gaps. Being provided with relevant data allows managers to report on a functional action plan and training needs by taking the data and turning it into something useful for the employee.
The process used to gather the 360 feedback ensures the report is representative, making it a much more insightful and objective source of feedback than top down yearly appraisals alone.
What Does a 360 Report Include?
At click360SelfDrive, our 360 degree feedback reports are compiled from the results of the 360-degree feedback survey that has been carried out in your organisation. Ratings are placed against individual questions and clustered under a set of behaviours (or competencies) that are considered important for leadership. The following headings are taken from our EiQ (Emotional Intelligence Questionnaire):
- Thinking Style
- Self-Awareness
- Motivation
- Empathy
- Social Skill
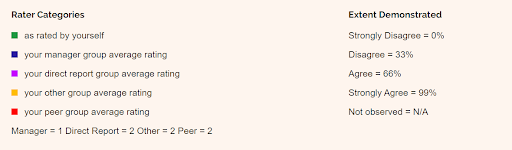
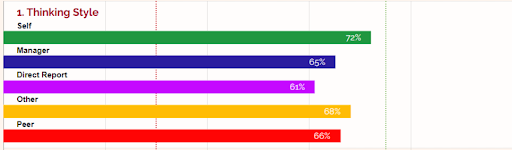
The individual 360 feedback report will include a summary of the extent to which you demonstrate each behaviour, as perceived by you and others. This will be summarised and represented using visual bar charts. The coloured bars in each graph compare self-ratings with the average of each of the other rater categories. It also tells you how many people completed the questionnaire and in which of the categories.
Understanding The 360 Report
A range of text, graphs, charts and tables are used to summarise the data in different ways, making it appealing to different individuals that learn in different ways.
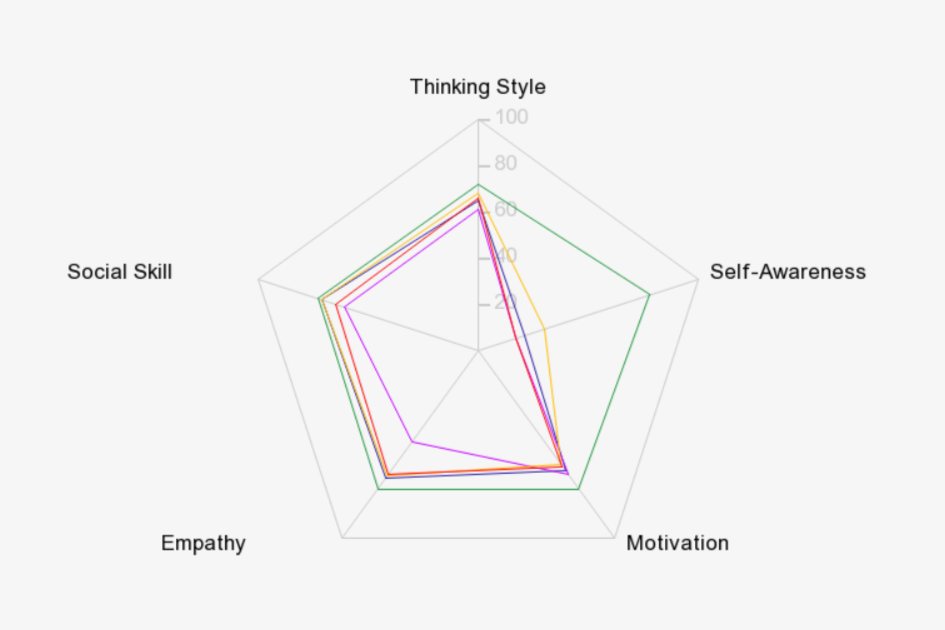
- Spidergram - this shows the extent demonstrated ratings for each rater category in an easy to read shape.
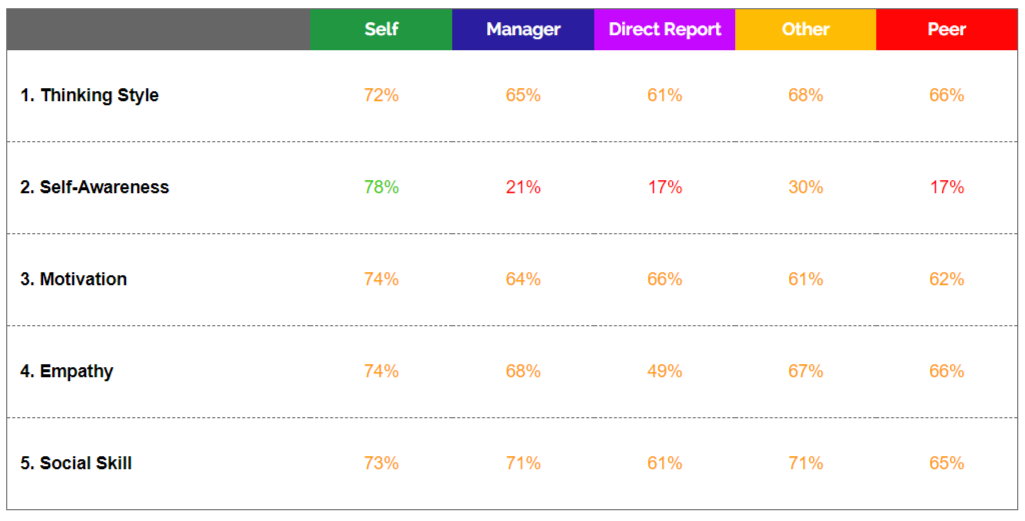
- Summary Table - this displays the extent that a particular behaviour is perceived in a tabular format.
- Detailed Analysis - provides individuals with separate results pages for each behavioural competency in the survey. This is shown as:
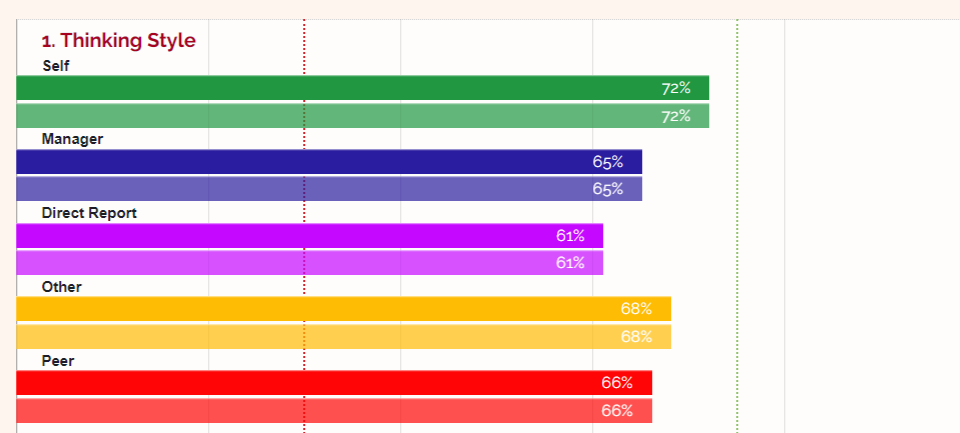
Overall analysis, where self-rating is compared to the combined respondent rating (the average of all other raters, excluding yourself).
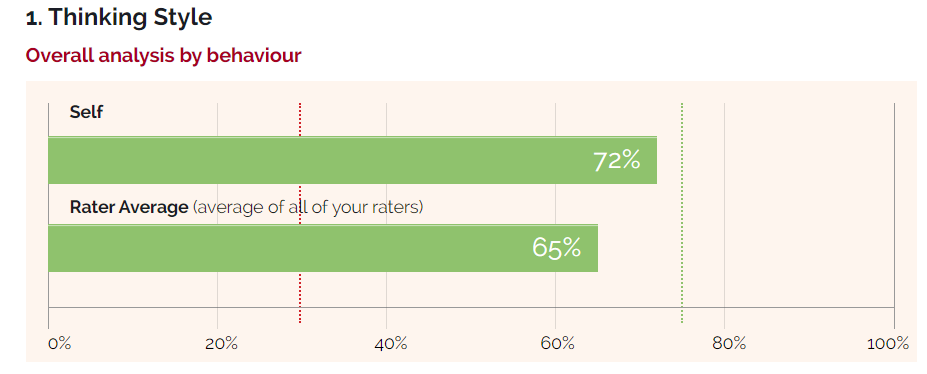
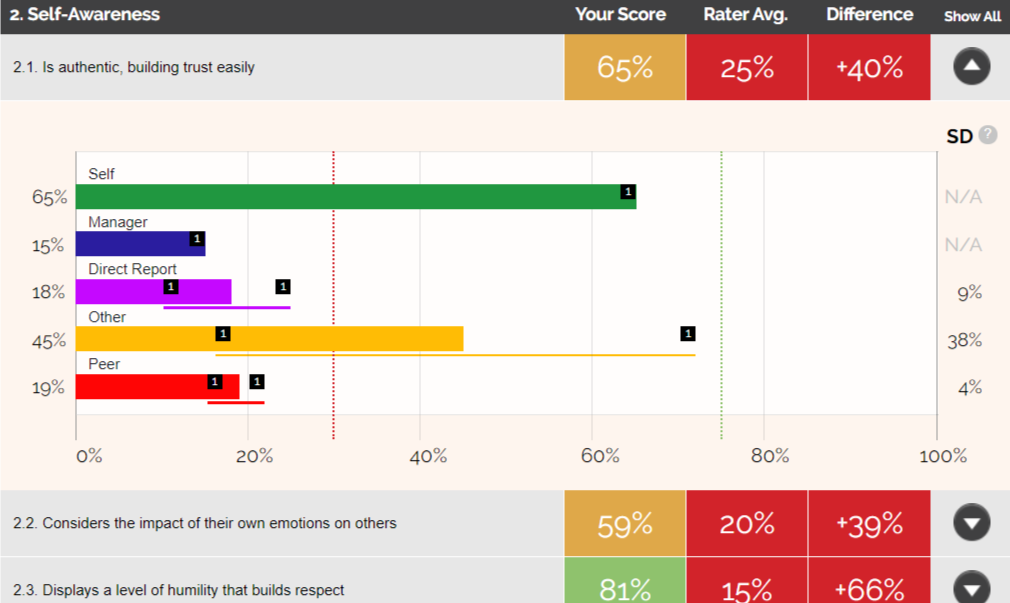
Detailed analysis displays each of the questions that sit under that behavioural competency. The expanded view includes the results from each rater category. The graph also indicates the extent of the range of views among respondents.
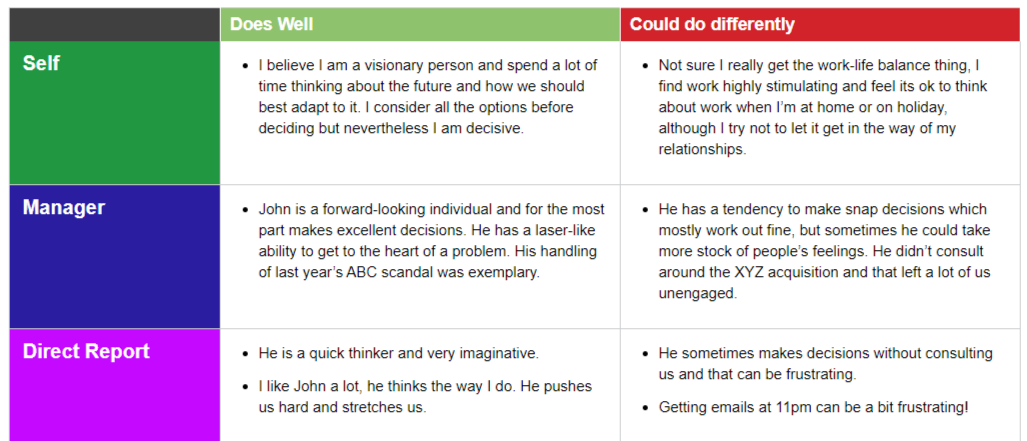
- Comments - these sit behind each behaviour or competency and highlight what you do well and what you could do differently. This may help explain or illustrate the ratings given in the first part of the report. The rater category from which the comment came is shown, but the identity of each is kept anonymous.
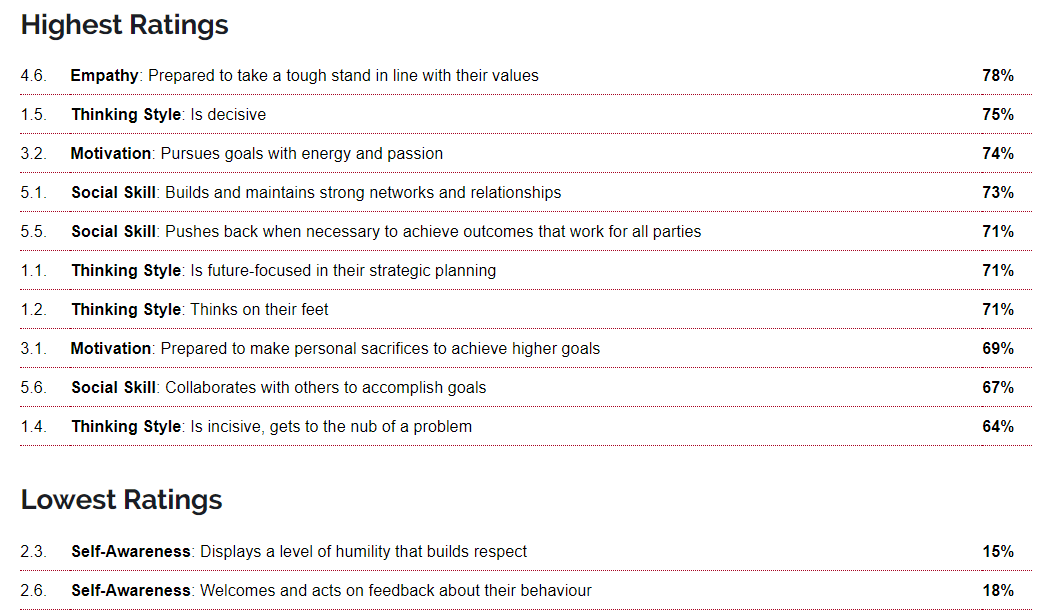
- Highest/Lowest Ratings - shows the top 10 questions that received the highest and lowest ratings; based on a ranking of all respondents' ratings for each question, excluding self.
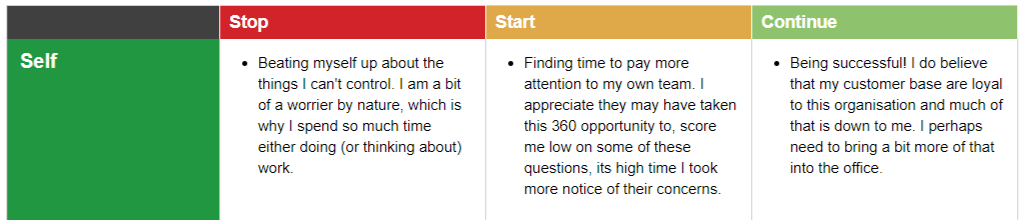
- Stop, Start, Continue - displays general comments that may add more depth and clarity to something related to the questionnaire or they may be outside the scope of the questionnaire. The rater category from which the comment came is shown.
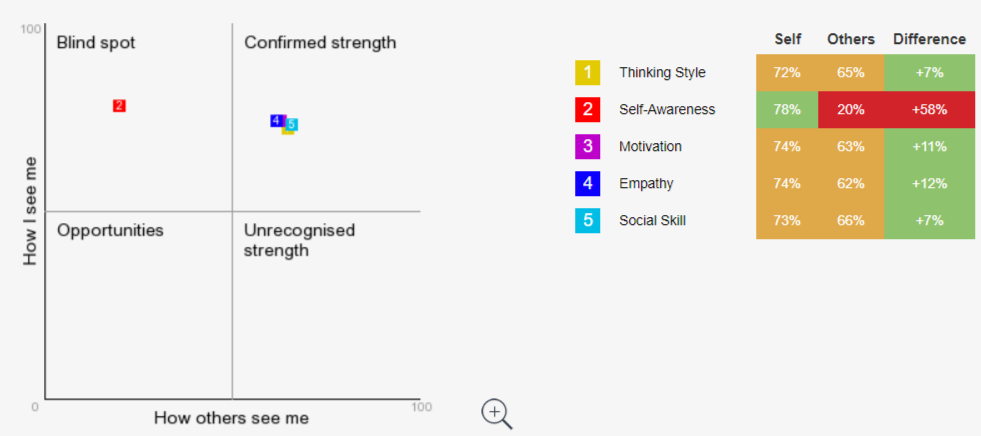
- Scatterchart - based on Johari’s Window this demonstrates the overall gap analysis for each competency. The chart is scaled to draw out the relative differences between ratings and may help you in planning for your development.
- Benchmarking - gives the average ratings received by everyone else who participated in this survey broken down into each rater category, and compared to your own feedback. If you are the only participant, the comparison bars will be of equal length to your own.
Individual VS Organisational Reports
As a standard, all of our 360 feedback includes individual reports, giving individuals a clear and simple view of their strengths and development priorities, a benchmark against those around them and lead to a clearly defined action plan.
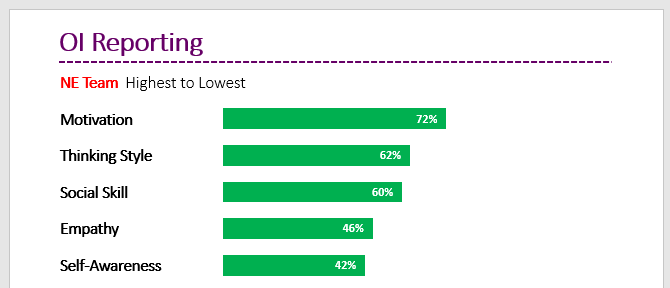
However, more and more organisations are requesting access to an organisational report, giving them a holistic view of their entire workforce, department or team. These Organisational Insights allow CEOs, MDs, Managers or HR Professionals to quickly and easily see which competencies are highest and which are lowest throughout the organisation. This birds-eye-view allows management to make more data driven decisions, supporting succession planning, talent management and other critical decision making processes involving people. These organisational insights can also illustrate a gap in departmental skills, allowing resources to be delegated more efficiently.
If you’re interested in implementing a 360 degree feedback process with access to individual reports and organisational insights, please get in touch today.